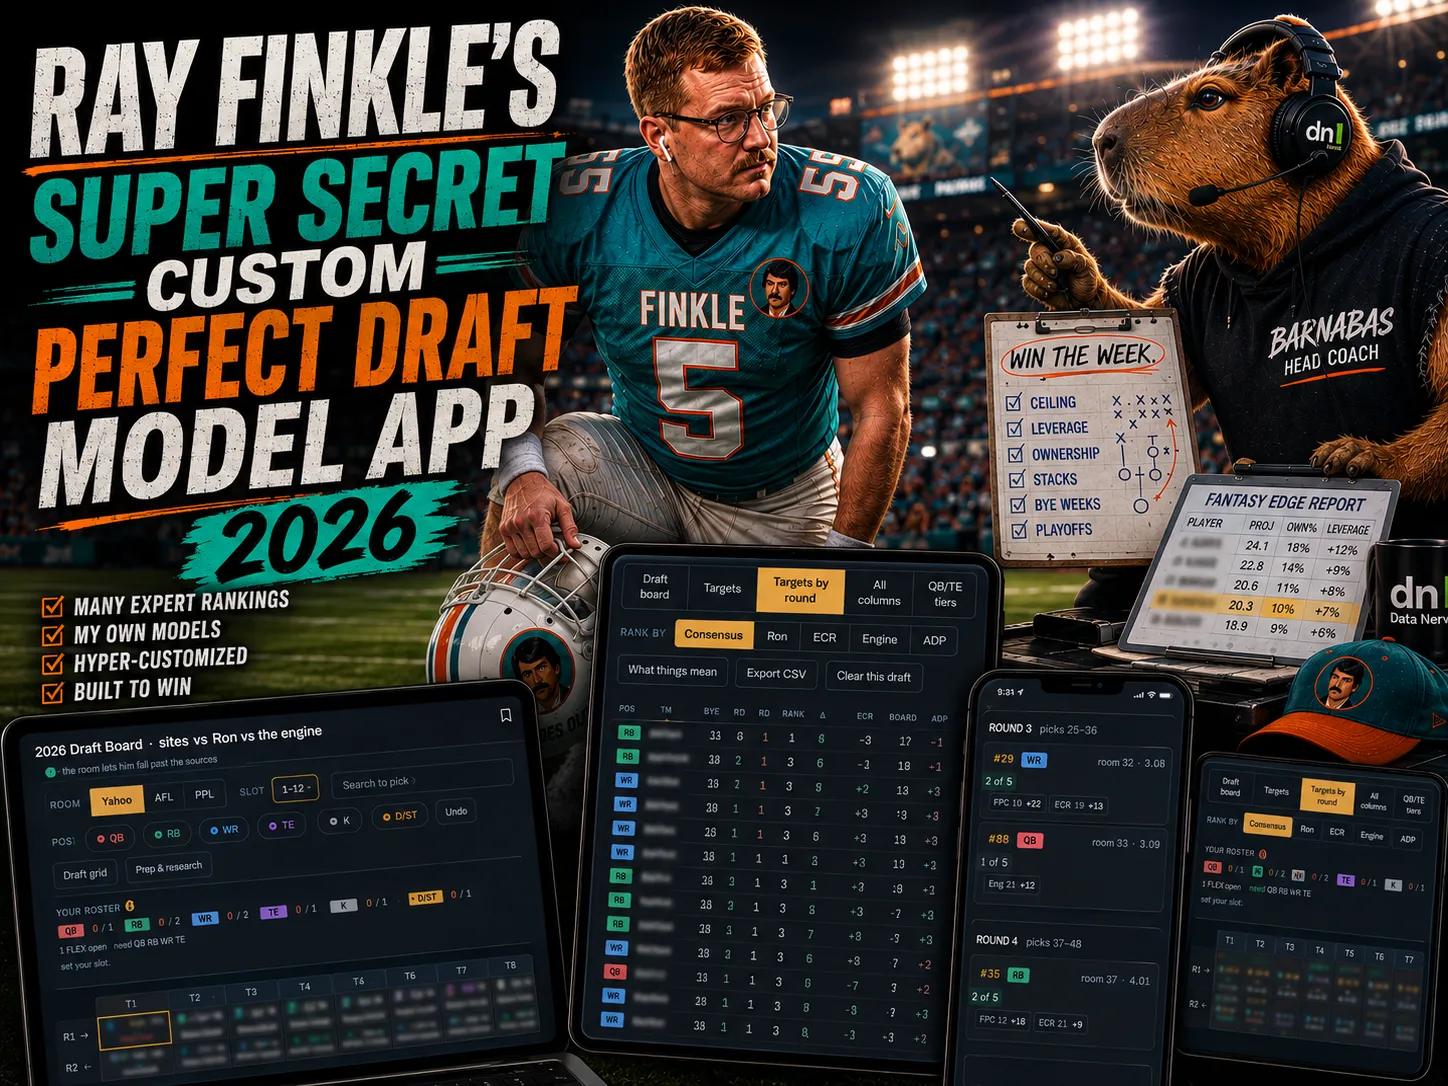
How it was built
One static page, rebuilt from inputs pinned to a capture date. Ten ranked lists reach a player's row and five of them vote, each re-priced first to the room's own scoring and roster, so the same player carries a different number in each of the three leagues. Six views, no network calls, every mark stored in the browser. The rankings stay behind the password until the drafts are done.
The 2026 draft, in numbers
General 2026 fantasy football analysis — the board's own conclusions are not on this page. Thirteen seasons of real draft prices joined to real box scores, 2,466 drafted player-seasons, plus the 2026 expert consensus, real-money draft prices, and the rooms' own suggested boards. Every rate carries a 95% uncertainty band.
The most veteran board in thirteen years
Four rookies inside the first 100 picks — the fewest since 2014. The unknowns were replaced by proven volume.
2026 expert consensus vs the twelve prior seasons' boards.
Data table
| Season | Rookies in top 100 |
|---|---|
| 2014 | 6 |
| 2015 | 8 |
| 2016 | 3 |
| 2017 | 5 |
| 2018 | 5 |
| 2019 | 7 |
| 2020 | 8 |
| 2021 | 8 |
| 2022 | 4 |
| 2023 | 6 |
| 2024 | 8 |
| 2025 | 9 |
| 2026 | 4 |
The experts stopped arguing. Mean rank disagreement on picks 37–100 is 11.9 — the tightest of thirteen seasons.
2026 captured 7 August with 87 experts; prior seasons early September with 82–237. An August board this tight is understated by the comparison, not inflated.
Data table
| Season | Mean expert rank SD, picks 37-100 |
|---|---|
| 2014 | 17.3 |
| 2015 | 16.4 |
| 2016 | 16.9 |
| 2017 | 17.3 |
| 2018 | 19.2 |
| 2019 | 16.9 |
| 2020 | 15.9 |
| 2021 | 14.6 |
| 2022 | 14.6 |
| 2023 | 14.6 |
| 2024 | 13.4 |
| 2025 | 14.6 |
| 2026 | 12.0 |
The running back dead zone is now permanent. Nine straight seasons the 12th back was gone inside pick 31. The last four, he lasts to 35–37.
Pick where RB12 leaves the board, by season's draft prices.
Data table
| Season | RB12 off the board at pick |
|---|---|
| 2014 | 21 |
| 2015 | 24 |
| 2016 | 31 |
| 2017 | 29 |
| 2018 | 22 |
| 2019 | 25 |
| 2020 | 21 |
| 2021 | 23 |
| 2022 | 20 |
| 2023 | 35 |
| 2024 | 37 |
| 2025 | 36 |
| 2026 | 37 |
What a round actually buys
Round 3 is where superstars stop existing. The odds of a top-5 positional finisher drop from 44% to 9% inside three rounds.
12-team PPR, 2013–2025. RB and WR — the only positions drafted in volume that early.
Data table
| Round | WR | RB |
|---|---|---|
| Round 1 | 44% | 32% |
| Round 2 | 27% | 24% |
| Round 3 | 9% | 8% |
The first receiver is the safest pick in fantasy. 88% of round-one WRs return a startable season, against 72% of backs — and half the bust rate.
Startable = WR3-or-better / RB2-or-better finish. Whiskers are 95% bootstrap bands.
Data table
| Position | WR3-or-better rate | 95% band | n |
|---|---|---|---|
| WR | 88% | [80, 96] | 57 |
| RB | 72% | [62, 80] | 90 |
Running back stops paying two rounds before anything else. The average back stops clearing his own replacement level at pick 37. Everything else lasts to 61.
Mean value over replacement by draft slot, 2013–2025. In the 61–84 band every position is under water.
Data table
| Position | Positive through pick | Goes negative at | Mean VOR, picks 61-84 |
|---|---|---|---|
| RB | 36 | 37 | -18.6 |
| WR | 60 | 61 | -9.4 |
| TE | 60 | 61 | -18.3 |
| QB | 60 | 61 | -12.5 |
The cliffs
The biggest cliff at every position is first to second. RB1→RB2 is −49 points. The most valuable thing in fantasy is being right about who finishes first, and nobody is.
Average season-end PPR points by positional finish, 2013–2025.
Data table
| Finish | QB | RB | WR | TE |
|---|---|---|---|---|
| 1 | 390.2 | 382.5 | 365.3 | 272.6 |
| 2 | 356.1 | 334.6 | 332.3 | 236.4 |
| 3 | 342.8 | 321.2 | 317.2 | 217.1 |
| 6 | 306.5 | 271.8 | 285.1 | 186 |
| 12 | 268.7 | 221.5 | 247.4 | 147.6 |
| 24 | 181.7 | 171.3 | 203.7 | 101.9 |
| 36 | 80.2 | 131.6 | 171.5 | 70.3 |
Why the early rounds are two positions. An elite back is worth 2.3× his replacement; an elite quarterback, 1.35×. That ratio — not any ranking — is the whole argument.
Top-3 seasonal average against the 12-team replacement level (QB12 / RB30 / WR36 / TE12).
Data table
| Position | Top-3 average | Replacement | Multiple |
|---|---|---|---|
| RB | 346.1 | 150.3 | 2.30× |
| WR | 338.3 | 171.5 | 1.97× |
| TE | 242 | 147.6 | 1.64× |
| QB | 363 | 268.7 | 1.35× |
What kind of player actually hits
Target share held is the marker that works. Early receivers who held 28%+ hit 79%, against 62% without it. Vacated opportunity is the marker that doesn't — the bands overlap, and what signal there is points the wrong way.
Hit = top-24 positional finish, compared inside the same price band. 95% bands, n on each row.
Data table
| Group | Marker | Hit rate | 95% band | n |
|---|---|---|---|---|
| WR, picks 1-36 | Held a 28%+ target share last season | 78.8% | [71.9, 85.5] | 66 |
| WR, picks 1-36 | Did not | 61.9% | [53.0, 71.8] | 126 |
| RB, picks 37-84 | 18+ touches a game last season | 42.9% | [30.4, 58.6] | 42 |
| RB, picks 37-84 | Under 13 touches a game | 25.9% | [14.1, 40.0] | 58 |
| WR, picks 37-84 | Under 15% of team targets vacated | 45.0% | [30.6, 64.0] | 60 |
| WR, picks 37-84 | 45%+ of team targets vacated | 26.5% | [15.6, 39.4] | 34 |
Tight end is the most volatile thing you start — and quarterback the least, at nearly half the swing.
Weekly coefficient of variation, 2013–2025 starter-level seasons.
Data table
| Position | Weekly CV |
|---|---|
| TE | 0.565 |
| WR | 0.528 |
| RB | 0.524 |
| QB | 0.382 |
ESPN hands two leagues with different rules the identical board. All 250 ranked players, same rank, in a full-PPR / 4-point room and a half-PPR / 6-point room. Confirmed twice, from separate captures: 5 August (258/258) and 8 August (250/250). Its auto-draft runs on that list — in one room it drafts to the wrong scoring, in the other it prices quarterbacks at the wrong rate. That is why you never let ESPN auto-draft for you.
ESPN sits 2.4× further from the money than Yahoo. Mean gap 12.0 picks against 5.0; 43% of its top 150 a full round off the real-money market, 14% two full rounds. Yahoo: 10% and 1%.
One dot per top-150 skill player: host list rank minus real-money draft price, in picks. Shaded zones: within one round, within two.
Data table
| List | Players | Mean gap | ≥1 round off | ≥2 rounds off |
|---|---|---|---|---|
| ESPN | 138 | 12.0 picks | 43% | 14% |
| Yahoo | 143 | 5.0 picks | 10% | 1% |
The one bias both platforms share: tight ends go early — ESPN by 12.7 picks on average, Yahoo by 8.4.
Mean signed gap to the money market by position.
Data table
| Position | ESPN tilt | Yahoo tilt |
|---|---|---|
| TE | -12.7 picks | -8.4 picks |
| RB | 3.6 picks | 0.0 picks |
| WR | 1.3 picks | 2.5 picks |
| QB | 0.4 picks | -0.2 picks |
ESPN's single worst call on a receiver, against where real money drafts him.
Its worst miss in the other direction — also a receiver. Yahoo's worst in either direction: 26.
No names on this page — the people in my leagues can read.
The rules move less than you think. The roster moves more.
Six points a passing TD is the most over-rated setting in fantasy. It adds ~55 points to every quarterback and leaves the QB1-to-QB12 gap exactly where it was: 72 points. It changes which quarterback, barely. It does not change when you take one.
2026 projected stat lines rescored under both rules.
Data table
| Setting | QB1 | QB12 | Spread |
|---|---|---|---|
| 4-pt passing TD | 361 | 289 | 72 |
| 6-pt passing TD | 416 | 344 | 72 |
What actually moves a board is the roster. Half PPR costs a top-24 receiver 44 points — then a 1-RB / 2-FLEX roster pushes receivers back past the scoring hit. Seven backs in the top twelve becomes four.
First 12 picks by value over each room's own replacement level. No generic list knows this.
Data table
| Room | RB | WR | TE | QB |
|---|---|---|---|---|
| ESPN, 4-point TD, full PPR | 7 | 4 | 1 | 0 |
| ESPN, 6-point TD, funky rules | 4 | 8 | 0 | 0 |
What half PPR takes from a top-24 season, by position.
Full-PPR points minus half-PPR points, 2026 projections, top 24 at each position.
Data table
| Position | Points lost, top 24 |
|---|---|
| WR | −44.2 |
| TE | −34.1 |
| RB | −23.3 |
Which kind of list wins the argument
Expert consensus beat market price in 8 of 9 clean seasons. Mean rank correlation with season-end points: 0.418 against 0.379.
The market here is free-site mock ADP — no historical real-money archive exists to test. Evidence that a well-built expert board is the better spine, not that price is worthless.
Data table
| Season | Experts | Market price |
|---|---|---|
| 2014 | 0.415 | 0.397 |
| 2016 | 0.234 | 0.223 |
| 2017 | 0.378 | 0.323 |
| 2018 | 0.397 | 0.343 |
| 2019 | 0.443 | 0.428 |
| 2020 | 0.431 | 0.350 |
| 2021 | 0.475 | 0.435 |
| 2022 | 0.481 | 0.488 |
| 2024 | 0.512 | 0.426 |
Where the experts are still fighting in 2026: receiver in rounds 6–9. Rank SD 17.0, a 91-place spread — the same band where receivers still pay and the backs have already died. The widest single disagreement in the top 100 runs from pick 51 to pick 241.
Mean expert rank SD by pick band, 7 August consensus.
Data table
| Picks | WR | RB | QB | TE |
|---|---|---|---|---|
| 1-24 | 4.0 | 5.1 | — | — |
| 25-60 | 9.1 | 7.8 | 10.5 | — |
| 61-108 | 17.0 | 12.1 | 11.7 | 12.4 |
| 109-180 | 28.1 | 22.5 | 18.8 | 24.1 |
Read before quoting
- The 2026 expert capture is 7 August with 87 experts; historical seasons are early September with 82–237. That timing difference cuts against the "experts stopped arguing" finding, not for it.
- Prices are the 4–11 August market and will move before the drafts.
- Every number on this page traces to public data — draft prices, box scores, published consensus. The board's own rankings and conclusions are not here, on purpose.